


Further statistical digging, just what everyone wants. This post is some more general statistics but more on what happened at the tournament rather than how individual armies did and this is going to focus on the mission parameters and how they compared against each other. Remember, whilst these parameters are looking at expanding upon the 5th edition constructs outline in the rulebook, one of them (Table Quarters) isn't in any of the BRB missions and both of the others have been changed in some fashion (no objective placement, marginal KP). That said, we want each of these parameters to be roughly equal to each other so no army is gaining a serious advantage across the whole tournament (six games, two of each as the primary) and we've changed objectives the least so we want to compare back to that parameter the most often. Let's see what we come up with!
First, we're going to look at how the primary, secondary and tertiary missions performed in terms of determining a winner/loser or providing a draw.

Let's look at three graphs first which show each individual parameter and the percentage of determining a winner compared to a draw across each round.

We see quite a big fluctuation in percentages here from 62% all the way up to 83%. What's interesting to note is this 83% (which seems significantly bigger than the other differences around it) is the Day 2 KP mission - perhaps by Day 2 players were more understanding of the missions and more able to play towards the primary with increased understanding and skill. This could be the case if we such spikes for TQ and OBJ in their respective missions. Otherwise a relatively even spread is still indicating the missions are balanced against each other.
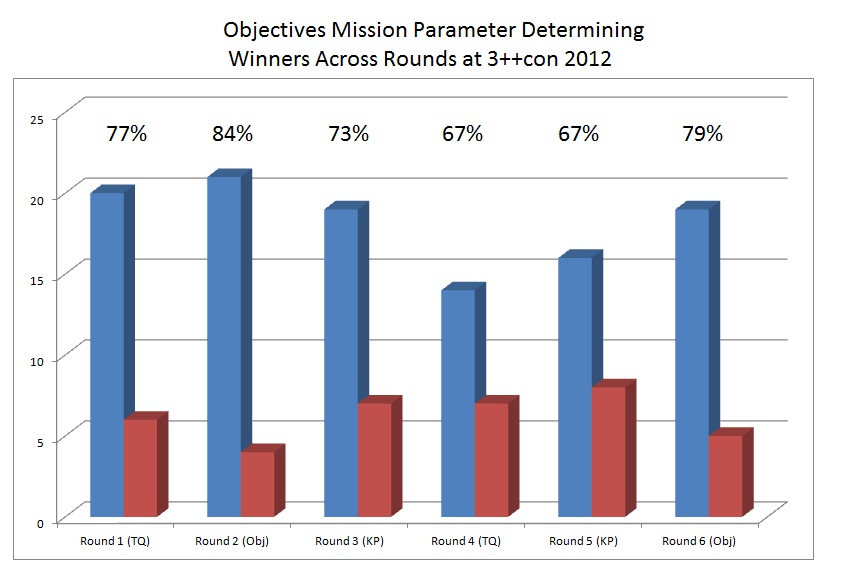
With objectives we're still seeing that big fluctuation from 67% to 84% but there is less consistency between this range compared to Kill Points. We also note the two highest percentages are during the Objective based missions - something which probably isn't surprising - and we are see an inverse effect on Day 2 in relation to Objective importance within the mission parameters. This might indicate the KP margin is too forgiving and one just gets consistent results throughout the mission cycle with them which is not something we want. Objectives being copy paste from the BRB minus placement is our best parameter to compare our others against.

Now here's a graph which makes almost no sense! We are again getting the fluctuation and a nice spread across the missions but the lowest mission percentages are the ones where Table Quarters are the most important parameter and the highest mission percentages are the ones where Table Quarters are the least important. Crazy but some subjective analysis might shed some light onto this. A LOT of people were confused about this parameter throughout the weekend and the most questions were asked about this. A lot of the time I had to go back to tables to make sure people had filled it out correctly as getting scores of 0-0 here is uncommon unless no one has Troops left (possible). Therefore I think a lot of error came into this and the most explanations were done after each of the Table Quarter rounds - hence the higher percentages of winner determination in the following rounds.
If this is the case and such understanding should hopefully translate the other way around and we'd see similar results to what happened with objectives. However, since this hasn't happened we essentially have three different datasets - not what we want when each parameter should be equal with the other. Let's look at the overall percentages the and see if we can't tease something out through averaging.

Now we are getting somewhere! This should be pretty easy to figure out - Objectives and Table Quarters were equal in determining winners whilst Kill Points were approaching 10% worse at this. Remember, 3++con used the marginal Kill Points system where three or more Kill Points were required to determine a winner rather than your straight up one Kill Point. This data suggests this was too severe in relation to other mission parameters. If we take a look at the data with the Kill Point margin as two KP we get...74%, nearly the exact same as the other two parameters...something to consider for mission balance in the future though this is also determined based upon army lists (though there was a good spread of army lists out there, so a 2KP margin might be the more accurate parameter in the future).
For reference, having straight KP would have resulted in a 90% win/draw parameter which would give us our current problem but in reverse and to a more extreme degree. These statistics therefore strongly suggest a KP margin is necessary to balance that factor against other parameters but a margin of three is perhaps too wide.
Conclusion
These statistics indicate there is pretty good balance across the tiered system which is something we perhaps did not expect but may be a sign of the tiers' balance. However, within the missions themselves we saw quite a bit of fluctuation in terms of what was determining the most winners in each round - something we probably would expect with either a inverse or direct effect. However, we were shown no effect, an inverse effect, and a direct effect dependant upon which parameter you looked at. Whilst there were some subjective hypothesis in regards to some of these (i.e. table quarters), this is something we certainly do not want to see. Further digging uncovered Kill Points was lagging behind the other parameters in terms of determining a winner and could be a possible explanation for why we didn't see an effect in terms of percentage of winners determined based on round. With some quick number crunching we found that decreasing the KP margin to two brought the Kill Points more in-line with the other parameters in de terming a victory.
All of these can lead us to (tentatively) conclude such a mission system is balanced though this would need to be tested to determine if inverse or direct effects are more likely within the mission parameters and to ensure a 2-KP margin maintains the same differentiating power as the other mission parameters. That being said, the NOVA based missions do seem to be balanced against each other in terms of the tiers which would also suggest its interaction with the major army types is non-significant.
Bla bla blee blee bla - the missions are good, keep using them with the aforementioned change!